I failed to reproduce my own results from a decade ago
My former PhD advisor emailed me recently regarding a grad student interested in using some experimental data we had collected a decade ago to validate some simulations. The repo from the experiment was still up on GitHub, so I assumed that would be easy, but I was wrong.
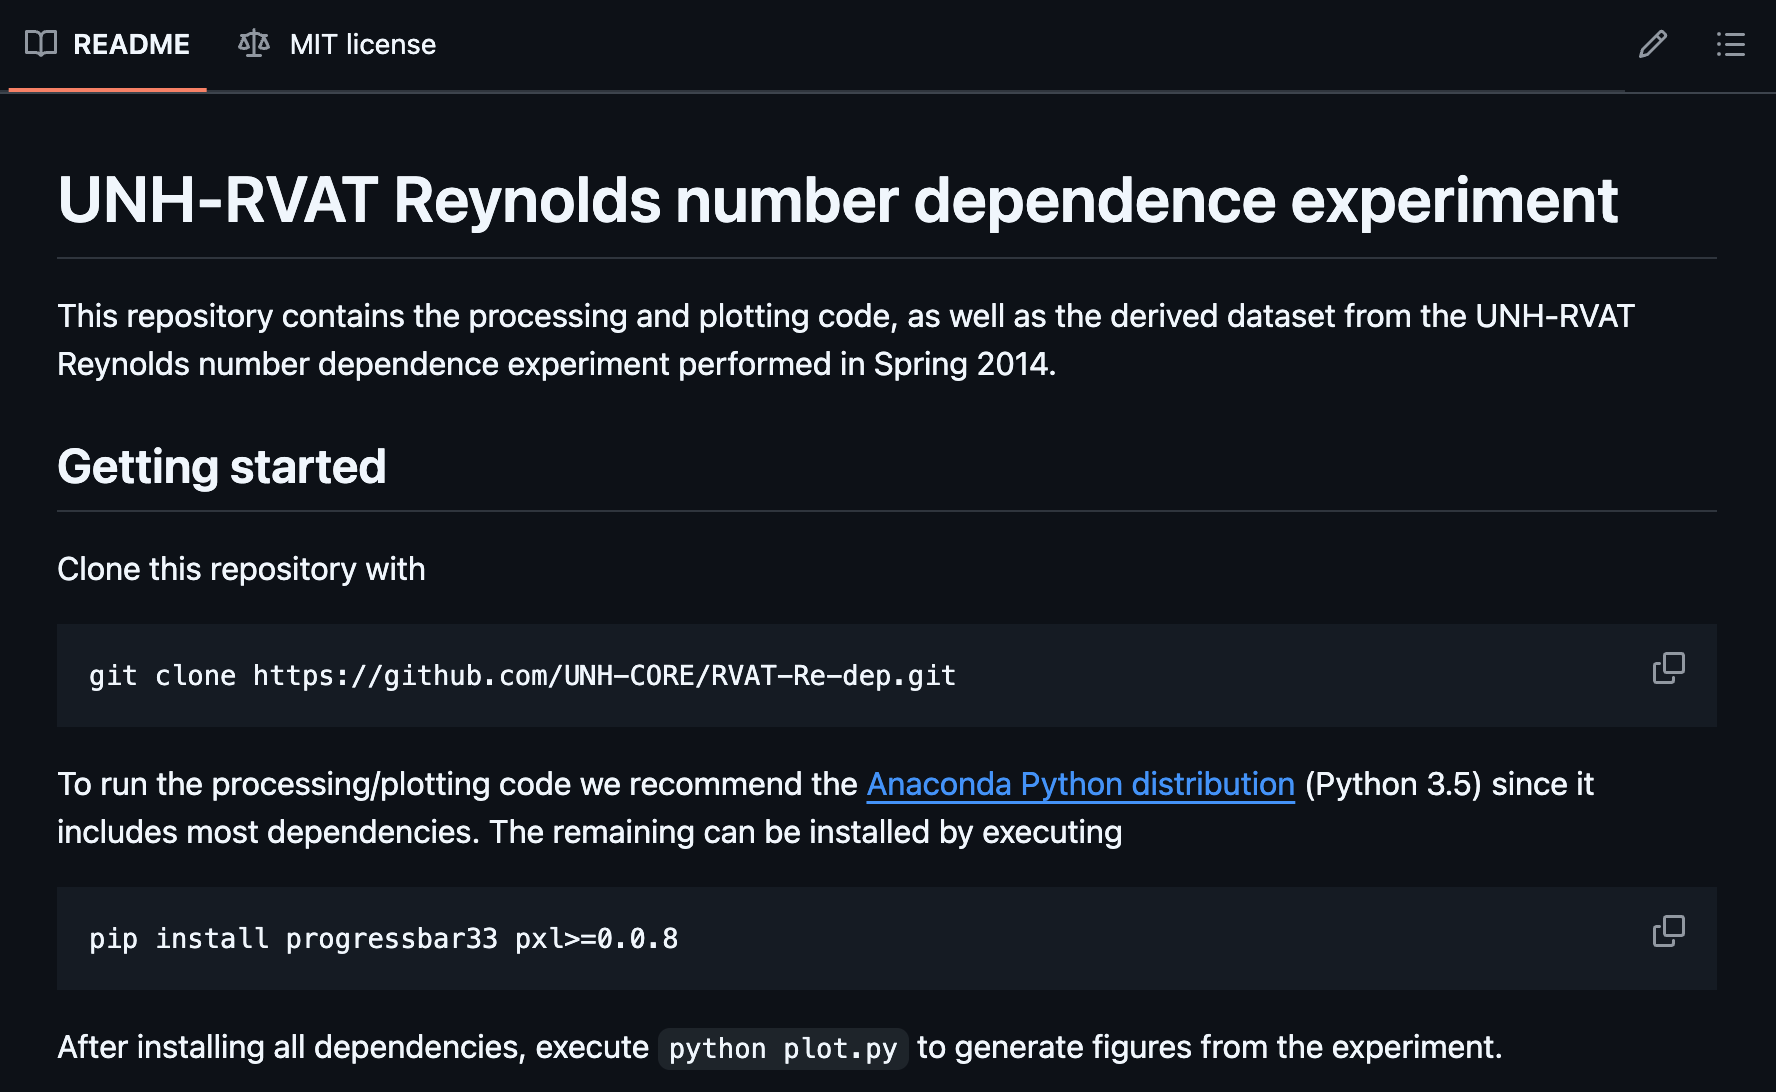
I had left instructions in the README for getting started and regenerating the figures:
So I gave it a try.
These days I have
Mambaforge
installed on my machine instead of Anaconda,
but the ecosystems are largely compatible with each other,
so I figured there was a decent chance this would work.
The pip install commands worked fine,
so I tried running python plot.py,
but that actually
doesn’t do anything without some additional options
(bad documentation, me-from-the-past!)
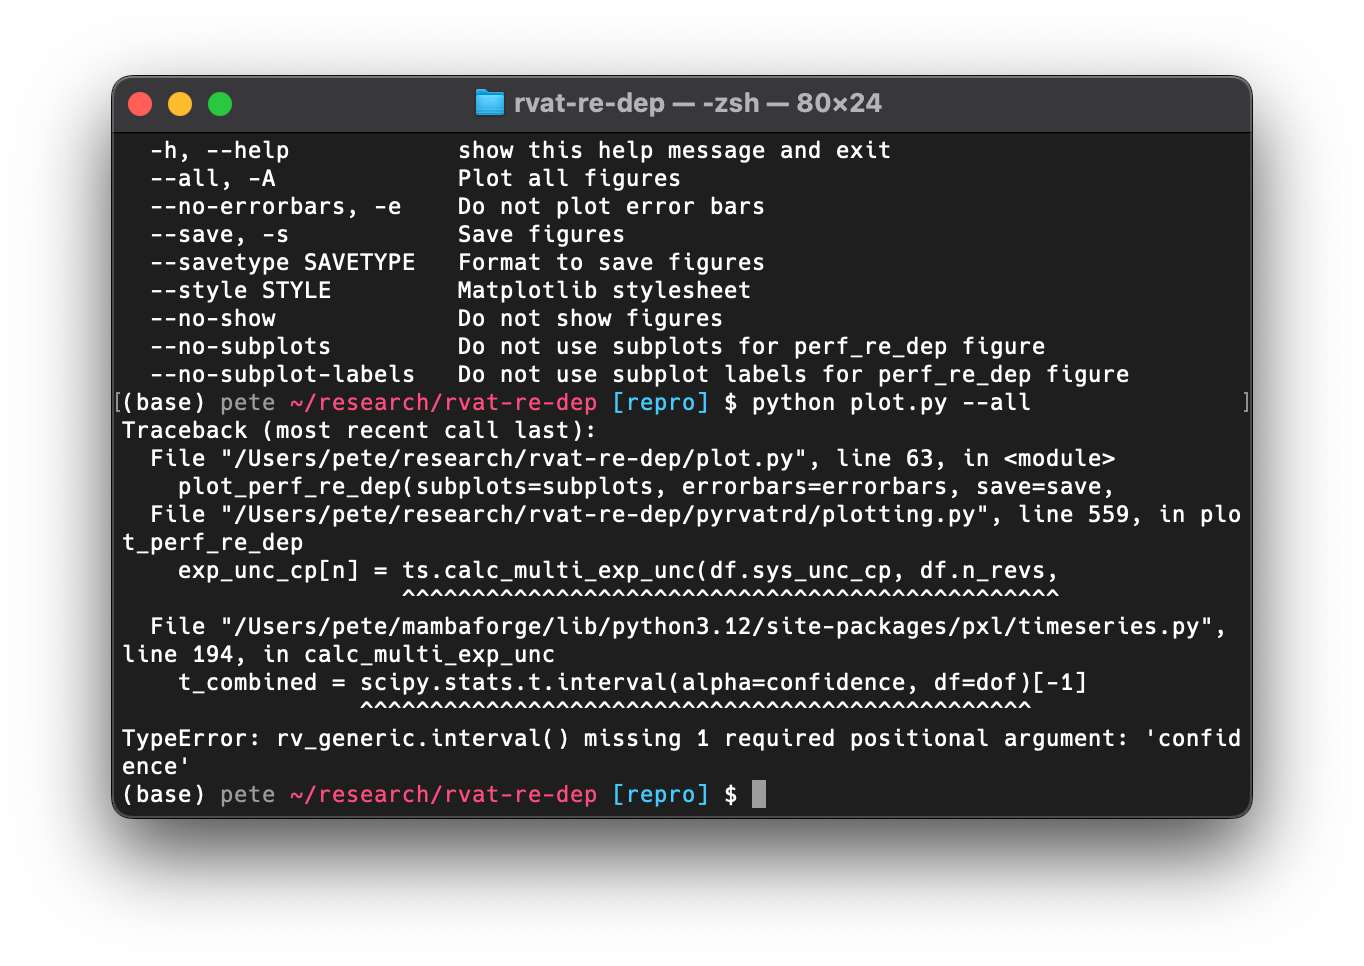
After running the correct command, this was the result:
As we can see,
this failed because
the interface to the scipy.stats.t.interval function had changed since the
version I was using back then.
This isn’t necessarily surprising after 10+ years,
but it puts us at a crossroads.
We would either need to adapt the code for newer dependencies
or attempt to reproduce the environment in which it ran before.
But let’s take a step back and ask why we would want to do this at all. I can think of two reasons:
- Reproducing the results can help ensure there are no mistakes,
or that the outputs (figures) genuinely reflect the inputs (data)
and processes (code). There is a chance that I updated the code at some
point but never reran
plot.py, making the figures out-of-date. - We want to produce a slight variant of one or more figures, adding the results from a simulation for the purposes of validation.
These can be categorized as reproducibility and reusability, respectively, and the grad student’s request was clearly concerned with the latter. However, I wanted to explore both.
Attempting to reproduce the old environment
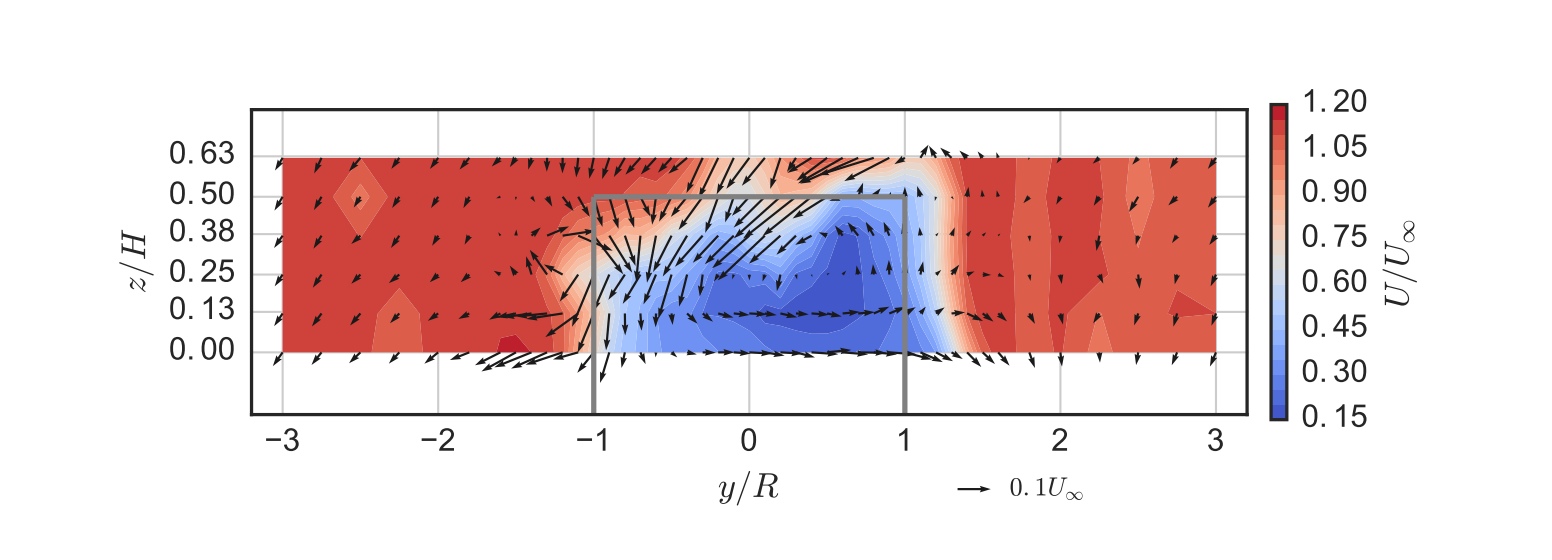
Before we start, let’s pick a figure from the original paper to focus on reproducing. For this I chose one that’s relatively complex. It shows out-of-plane mean velocity in a turbine wake as contours and in-plane mean velocity as vector arrows, and includes an outline of the turbine’s projected area. It uses LaTeX for the axis labels, and is set to match the true aspect ratio of the measurement plane. Here’s what it looked like published:
I left myself some incomplete instructions in that README
for reproducing the old
environment: Install a version of Anaconda that uses Python 3.5
and pip install two additional packages.
Again, bad documentation, me-from-the-past!
Given that I already have conda installed,
I figured I could generate a new environment with Python 3.5
and take it from there.
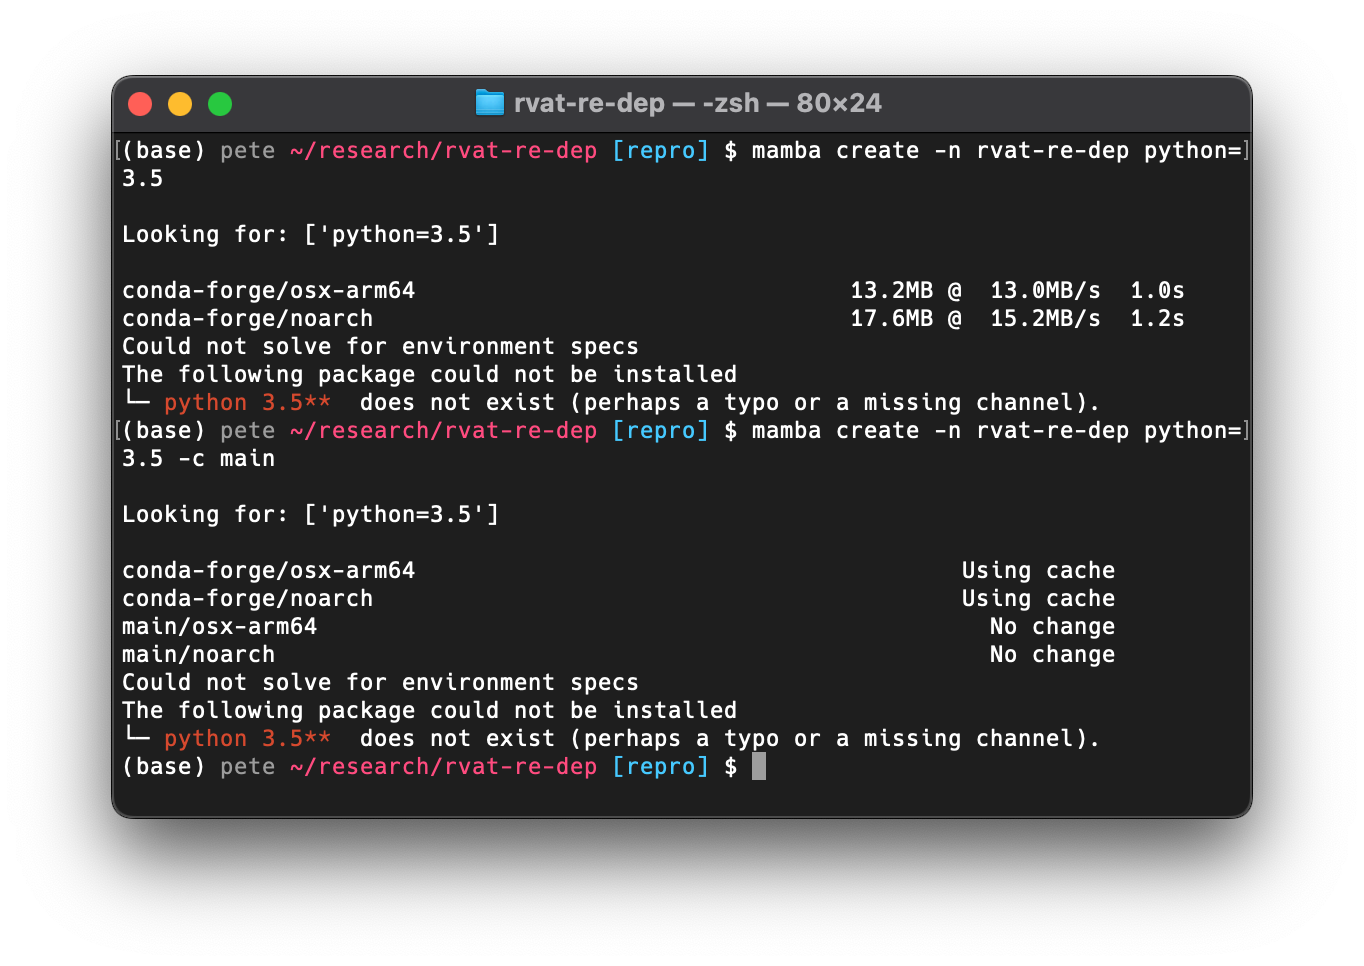
No luck, however.
Python 3.5 is not available in the conda-forge or main
channels any longer,
at least not for my MacBook’s ARM processor.
The next logical option was Docker. There are some old Anaconda Docker images up on Docker Hub, so I thought maybe I could use one of those. The versions don’t correspond to Python versions, however, so I had to search though the Anaconda release notes to find which version I wanted. Anaconda 2.4.0, released on November 2, 2015, was the first version to come with Python 3.5, and that version is available on Docker Hub, so I tried to spin up an interactive container:
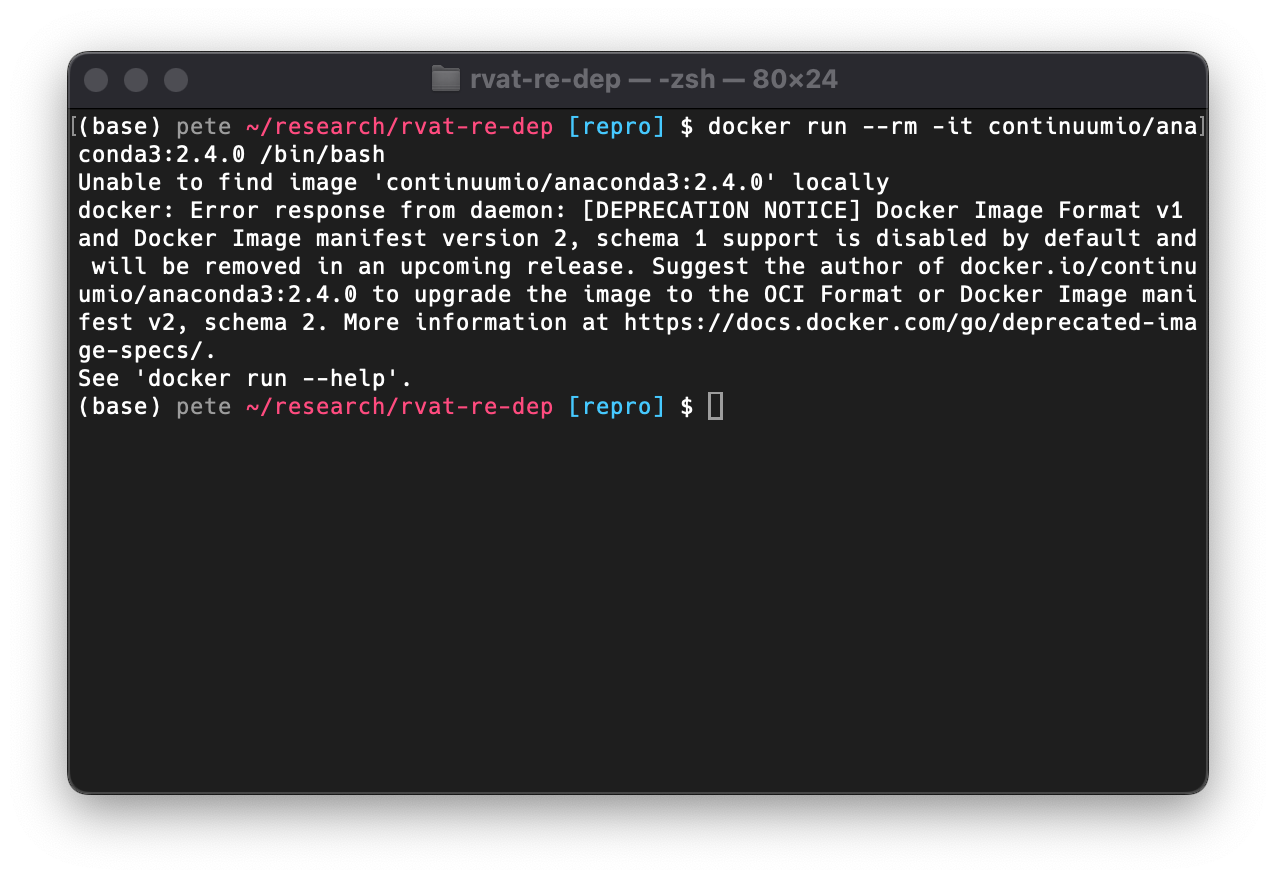
To my surprise, this failed. Apparently there was a change in Docker image format at some point and these types are no longer supported. So I searched for the newest Anaconda version with Python 3.5, which was Anaconda 4.2.0, and luckily the image was in the correct format.
At this point I needed to create a new image derived from that one that
installed the additional dependencies with pip.
So I created a new Docker environment for the project
and added a build stage to a
fresh
DVC
pipeline with
Calkit
(a tool I’ve been working on inspired by situations like these):
calkit new docker-env \
    --name main \
    --image rvat-re-dep \
    --from continuumio/anaconda3:4.2.0 \
    --description "A custom Python 3.5 environment" \
    --stage build-docker
In this case, the automatically-generated Dockerfile didn’t yet have
everything we needed, but it was a start.
Simply adding the pip install instructions from the README resulted in
SSL verification and dependency resolution errors.
After some Googling and trial-and-error,
I was able to get things installed in the image by adding this command:
RUN pip install \
    --trusted-host pypi.org \
    --trusted-host pypi.python.org \
    --trusted-host files.pythonhosted.org \
    --no-cache-dir \
    progressbar33 \
    seaborn==0.7.0 \
    pxl==0.0.9 \
    --no-deps
Note that I had to pin the seaborn version since pxl would install a
newer version, which would install a newer version of pandas,
which would fail, hence the --no-deps option.
I also had to set the default Matplotlib backend with:
env MPLBACKEND=Agg
since PyQt4 was apparently missing and Matplotlib was trying to import it by default.
After running the pipeline to build the Docker image, I ran the plotting script in that environment with:
calkit runenv -n main -- python plot.py all_meancontquiv --save
Let’s take a look at the newly-created figure and compare with the original published version:
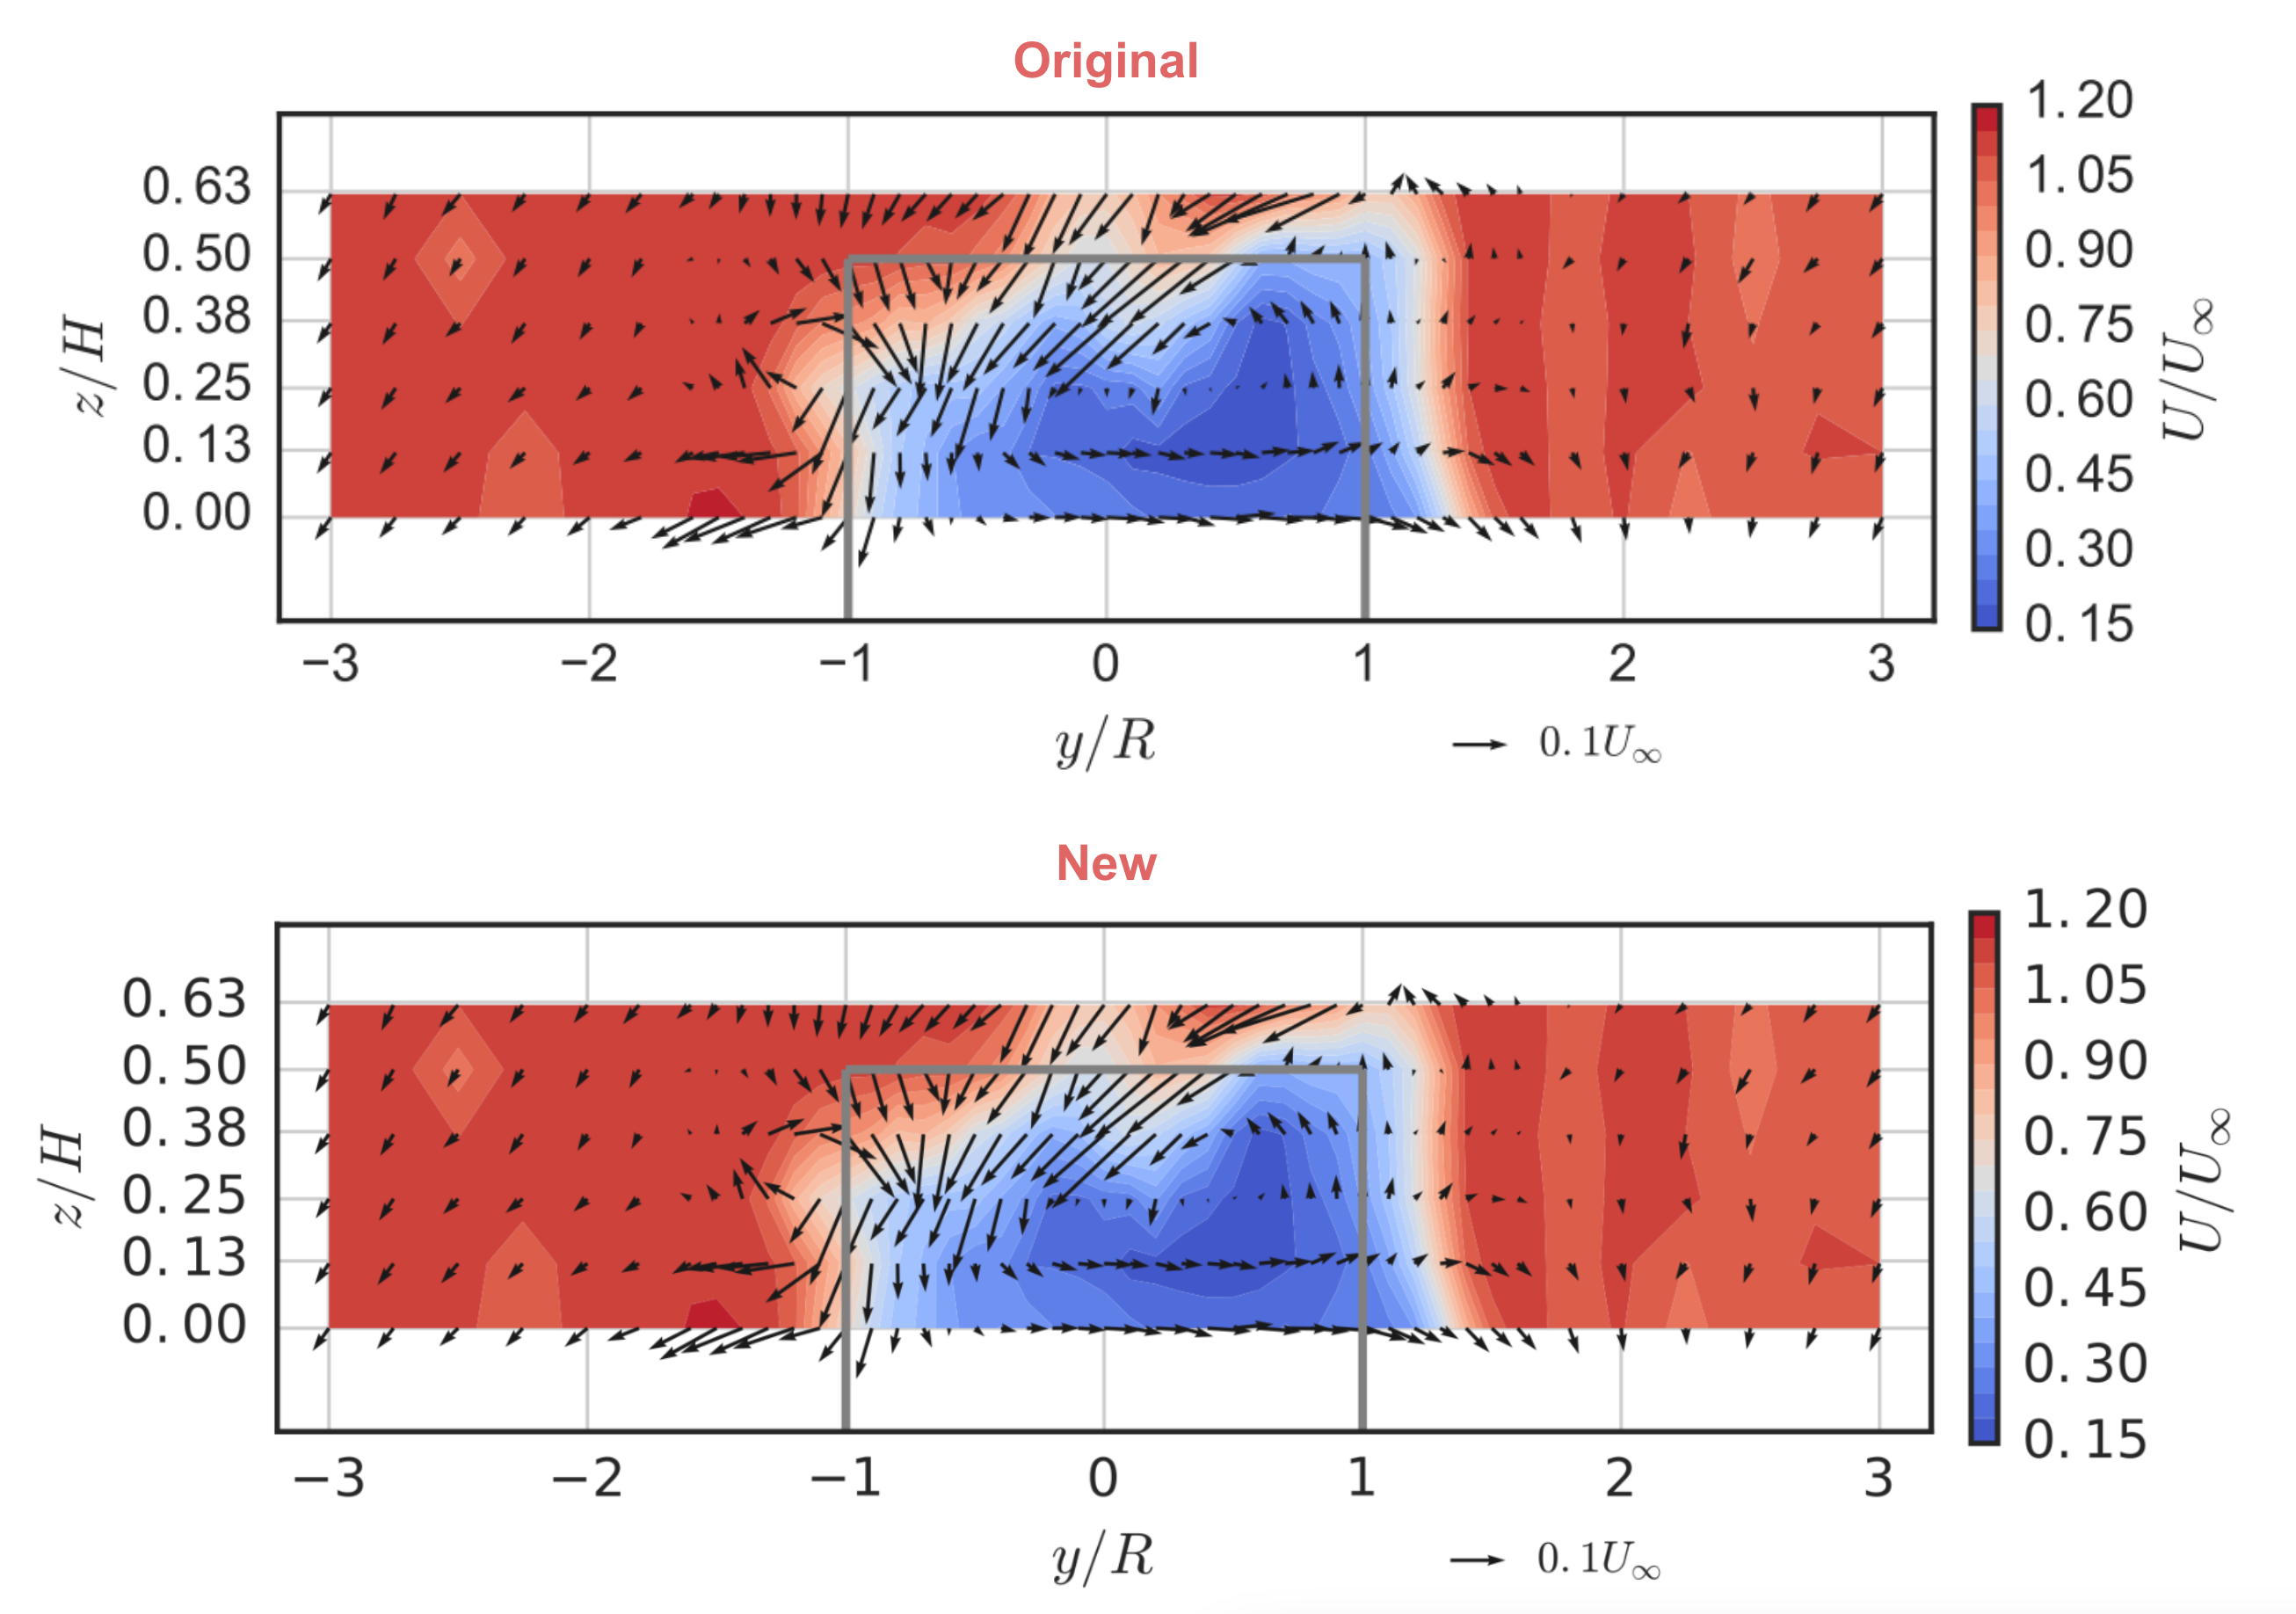
If you look closely you’ll notice the font for the tick labels is slightly different from that in the original. We could go further and try to build the necessary font into the Docker image, but I’m going to call this a win for now. It took some hunting and finagling, but we reproduced the figure.
But what about reusability?
Looking back at project repo’s README we can see I said absolutely nothing about how one could reuse the materials in a different project. To be fair, at the time the main purpose of open sourcing these materials was to open source the materials. Even that is still somewhat uncommon for research projects, and I do think it’s a good goal in and of itself. However, if we want to ensure our work produces the largest possible impact, we should do a little “product management” and spend some time thinking about how others can derive value from any of the materials, not just the paper we wrote.
I actually used this dataset in a later paper validating some CFD simulations, the repo for which is also on GitHub. Looking in there, the value that this project’s repo provided was:
- CSV files containing aggregated or reduced data.
- A Python package that made it possible to:
- recreate the Matplotlib figures so we didn’t need to copy/paste them,
- instantiate a
WakeMapPython class that computed various gradients to aid in computing wake recovery quantities to compare against simulation, - inspect the code that generated complex figures so it could be adapted for plotting the CFD results.
Items 2.1 and 2.2 were actually not that easy to do,
since the Python package was not installable.
In the follow-on project
I had to add the folder to sys.path to import the package,
and since it used relative paths,
I had to make the new code change directories
in order to load the correct data.
These are both not too difficult to fix though.
First, we can make the Python package installable by
adding a pyproject.toml file.
Then we can
switch to using absolute paths
so the data loading and plotting functions
can be called from outside.
Updating the code for the newer dependencies was not too difficult based on the tracebacks. After getting things running in a more modern Python 3.12 environment, I exported a “lock” file describing all versions used the last time it successfully ran. This is much more descriptive than “Anaconda with Python 3.5.”
Finally, I wanted to add some documentation explaining how to reuse this code and data. I ended up adding two sections to the README: one for reproducing the results and one for reusing the results. I also created an example project reusing this dataset by including it as a Git submodule, which you can also view up on GitHub. Doing this is a good way to put yourself in the users’ shoes and can reveal stumbling blocks. It also gives users a template to copy if they would find that helpful.
It’s important to note here that it’s impossible to predict how others might derive value from these materials, and that’s okay. Take some educated guesses, put it out there, and see what happens. Maybe you’ll want to iterate later, like I’ve done here. That’s much better than not sharing at all.
Conclusions
There are a few takeaways from this exercise. First off, reproducibility is hard, even with all of the code and data available. Software and hardware continue to evolve, and just because the code “runs on my machine” today, doesn’t mean it will a few years (or decades) down the road. On the other hand, maybe reproducibility should have a practical expiration date anyway, since it’s mostly useful around the time of publication to help avoid mistakes and potentially speed up peer review.
Another important but obvious point is that documentation is crucial. Simply providing the code and data without documentation is better than nothing, and many papers don’t even go that far, but we really should go further. Every project should fully describe the steps to reproduce the outputs, and there should be as few steps as possible. This can be beneficial while the project is in progress as well, especially if we have collaborators.
Lastly, reproducibility is not the same thing as reusability. Researchers should do some product management and attempt to maximize the value they can deliver. The “product” of a given research project could be a simple formula for hand calculations, but these days the valuable products will likely include datasets and software.
Publishing a paper with an “in-house” code may be good for your career (for now anyway,) but if your discoveries are useless without a computer program to calculate predictions, the effort others will need to expend to get value from your work will be unnecessarily high, and therefore some potential impact will be unrealized. “It’s not documented well enough” is not a valid excuse either. Like with reproducibility, even if we haven’t molded our research products into the most user-friendly form possible, we should still share all of the relevant materials, so long as it’s not harmful to someone else to do so.